How will the addition of 2 new teams impact the P&L of current teams?https://qwixpert.com/wp-content/uploads/2023/07/82858638_s.jpg660726qwixpertadminqwixpertadminhttps://secure.gravatar.com/avatar/392f1042eaff5c1f343a179d15026010?s=96&d=mm&r=g
The pandemic has changed the lives of millions across the globe, personally and professionally. Entertainment is no outlier, with India’s cricket-crazy fan base missing the experience of live matches. The 2020 IPL season was a much-awaited bloom in the drought. BARC India’s viewership data indicates an overwhelming response to IPL 2020. 405 million viewers tuned in to watch the IPL. Indian audiences consumed 400 billion minutes of IPL this year, leading to a 23% increase in consumption over the previous year.
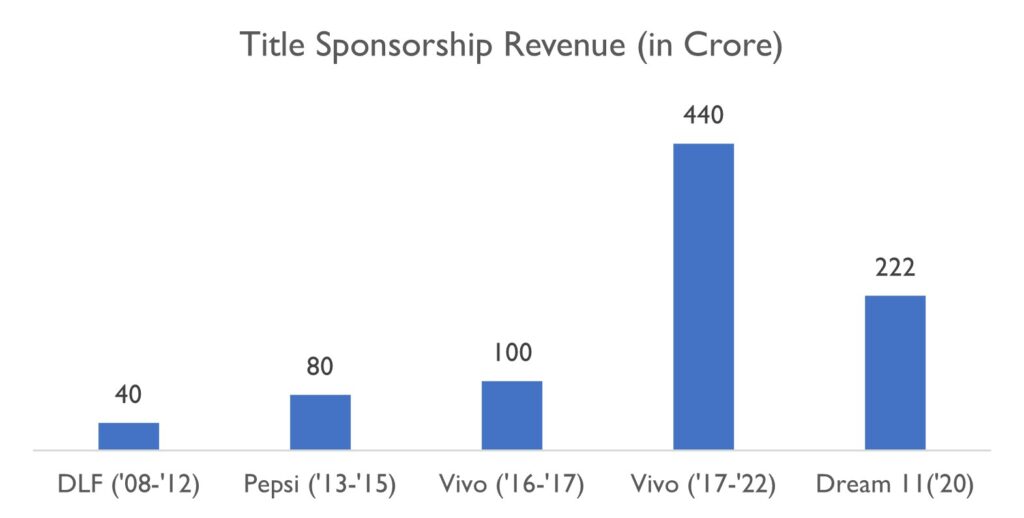
The franchise finances have, however, taken a hit this year. Revenues dropped significantly due to the lower title sponsorships (Vivo’s Rs. 440 Cr. vs. Dream 11 Rs. 222 Cr.), reduced jersey sponsorships, and loss of match day income due to the shifting of venues to Dubai.
Will adding two new franchises be a boon or a bane for the existing franchises? If added, how will it further affect the business prospects of existing franchises?
Teams may have to take home a lower share of the broadcasting rights revenues – their major revenue contributor
Currently, the eight teams play a total of 56 matches in a league format (both home and away) and 4 matches in the knockout round, resulting in a total of 60 matches. If the BCCI members (state associations) approve two new teams in the annual meeting in December end, it will not be the first time the IPL has had ten franchises in a season. In 2011, BCCI added Pune Warriors and Kochi Tuskers to the original roster of eight franchises. The home-and-away format, which would have meant a total of 94 matches, was shelved due to fear of burnout. Consequently, the IPL split the ten teams into two loose groups with 70 league matches and four playoff games. Teams, though, were ranked together in one composite league table.
The proposal by BCCI for the new IPL format, if the two new teams are added, is that during the league phase, every team will play the same number of league matches (14) as of today. The teams will be split into two groups of 5. Each team will play the other four in their group, in both home and away format (8 matches), four of the teams in the other group once (4 matches, either home or away), and the remaining team in the other group twice, in both home and away. A random draw will decide the groups’ composition and who plays whom across the groups once and twice.
The broadcasting rights revenue of Rs 3,200 from Star India is less likely to increase with the addition of 2 new teams, especially with the tournament length unchanged. Hence the central rights share given to the franchises is expected to remain the same at Rs 1,600. The addition of 2 teams may lead to the existing teams getting a 20% (Rs 40 Cr) lesser share of central revenue. While the title sponsorship fell by ~50% in IPL 2020, it is expected to increase in 2021 and beyond as the tournament returns to India.
Franchisees must leverage sponsorships and brand extensions to offset rights income drop
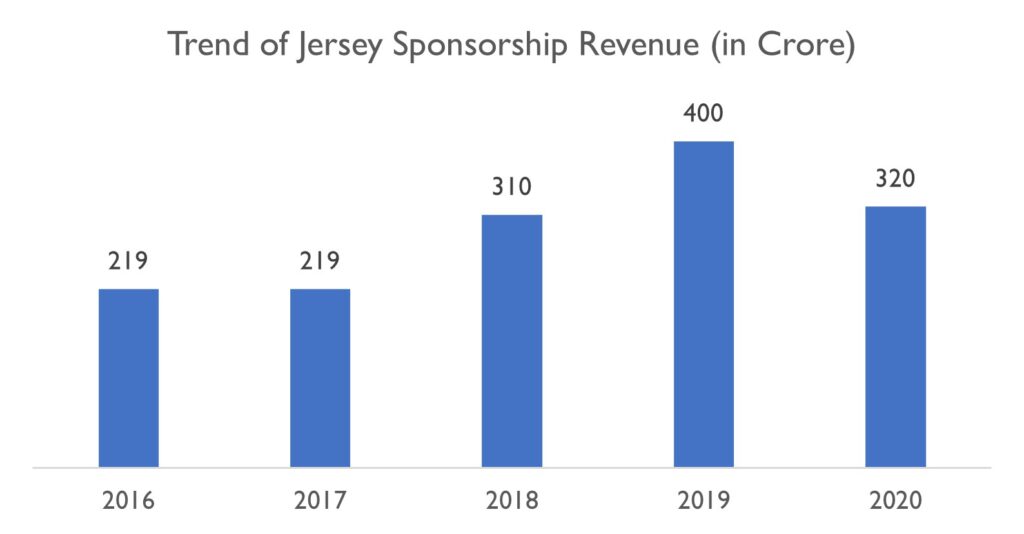
Leading franchises have seen a 10-15% decline in 2020; for the rest, sponsorship amount has dropped by 25-30%. This year the eight franchises are estimated to have earned anywhere between Rs 300-350 crore, compared to Rs 400 crore last year.
The top four franchises earn between Rs 70-80 crore from sponsorship, while the remaining four franchise’s earnings ranges from Rs 30 to Rs 40 crore. Even as franchises could close most of the deals before lockdown, a lot of the inventory, such as space at the back of the helmet, non-leading arm, remained unsold.
From 2016 – 2017 the eight teams’ total sponsorship revenue remained flat at Rs 219 crore. In the 2018 edition of IPL, sponsorship revenue grew by 37% – 46%. The total sponsorship pacts signed by the eight teams were in the range of Rs 300–320 crore.
Sponsorships are dependent on the team’s star players and fan base. New franchisees may struggle to generate much in the initial seasons. However, the existing franchisees having an established core group of international stars and cultivated a loyal fan following will continue the growing trend. Brand extensions will become significant as teams identify ways to engage fans even beyond the IPL season. RCB Bar and Café, inaugurated on 19th Dec in the heart of Bangalore, is a case in point.
Ticketing Revenue may shrink by ~10% – 15% with lower home matches/team; a holistic approach to augmenting in-stadium revenues imperative
BCCI, in the past, had compensated franchises when the T20 tournament moved out of India to countries such as South Africa and UAE – the situation was different this year. The teams had to let go of earning from the ticket sale, which amounts to ~Rs. 400 crore. While upcoming seasons are expected to happen in India, 1 or 2 lesser home matches/team indicates lower earnings. With occupancy at ~87% overall, teams will have to maximize seat utilizations through intelligent use of analytics and augment in-stadium revenues with activities engaging fans pre- and post-matches.
Conclusion
BCCI’s AGM on 24th Dec 2020 is likely to pass the proposal to add two new teams to the IPL. It is expected that the 2021 season will remain unchanged with a mini-auction in February. The 2022 season will start with a mega auction at the beginning of 2022. This allows sufficient time for franchisees to prepare in the back end – with coaching and support staff, talent scouts identifying potential auction picks, sponsorship and marketing planning, stadium preparation, and pre-season fan engagement.
BCCI may tweak the share of central rights income from 50:50 to 60:40. While this impacts BCCI’s revenues, the new franchisee bids (Expected @ $300 Mn as per a Times of India report) is expected to compensate for the drop. However, teams must develop self-sufficiency in income generation and not remain overly dependent on the central rights income share. Enriching the in-stadia experience for fans will augment income generation. Fan and sponsor engagement beyond the playing season to generate higher sponsorship and brand extension incomes are critical for long term franchisee viability.
The BCCI’s AGM will throw some light on the upcoming IPL seasons. For the cricket crazy fans at large, the show gets only more exciting.
What should auto manufacturers do to succeed in the Electric Vehicle era? – Automotive industry’s smartphone momenthttps://qwixpert.com/wp-content/uploads/2023/07/EV-Charging-Main-Picture.jpeg774619qwixpertadminqwixpertadminhttps://secure.gravatar.com/avatar/392f1042eaff5c1f343a179d15026010?s=96&d=mm&r=g
Executive summary
The migration to Electric Vehicles from Internal Combustion Engine technology has gathered pace. Customer anxieties over their purchase and usage, while they remain, are declining. Regulatory authorities, manufacturers, and investors have set themselves ambitious targets and work in overdrive to achieve them. Players across the automotive value chain are facing disruption. Adoption and migration to the new normal are critical to avoid obsolescence. Manufacturers will need to diversify their portfolio, invest in R&D and capability development, cooperate with competition to overcome product obsolescence or end up being upstaged by new-age competitors. Regulatory impetus, a significant reduction in the number of moving parts, and lower cost of ownership will drive manufacturers to innovate through value engineering. More than 90% import of EV components as of date presents opportunities for local substitution. India must continue its global leadership in automotive manufacturing by investing early in EV. Loss of jobs and livelihoods expected across OEMs and OES. The Government needs to step-in with a holistic plan, including revamping the current educational system, to secure careers and develop an EV-specific talent base. Global geopolitics may shift from the Gulf to South America if and when Lithium becomes to new oil.
Electric vehicles technology is disrupting the entire automotive value chain
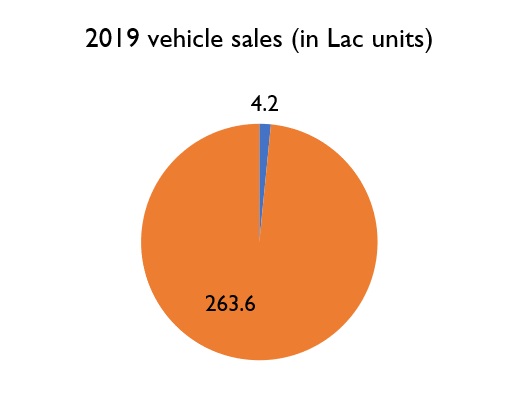
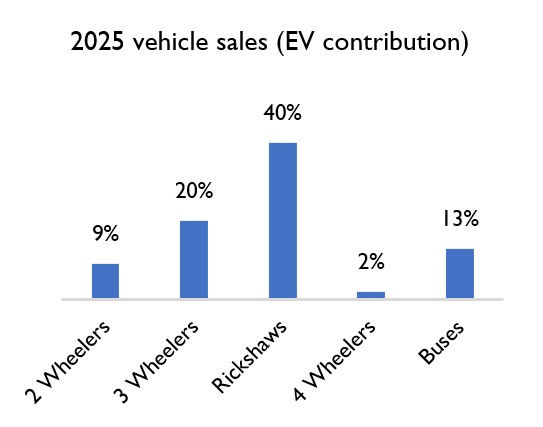
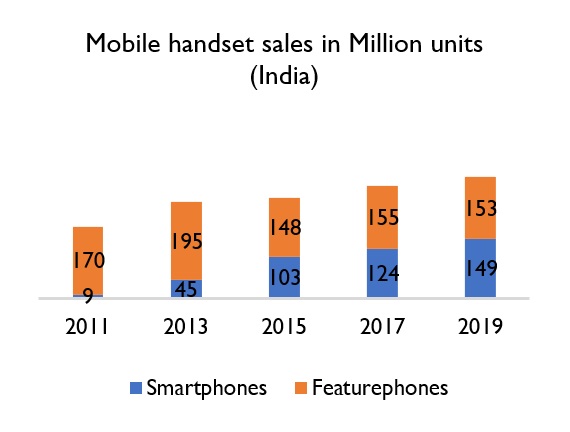
A decade ago, feature phone manufacturers overlooked the disruption from smartphones. The 16x sales growth of smartphones over a decade and a ~50% market share (in 2019) in the mobile handset category (Fig. 3) shares lessons for the automobile industry. The $118 bn automobile industry, contributing to around 7% of the Indian GDP, is expected to contribute over 35 million jobs to the Indian populace. Further, auto exports contribute to Rs. 1.0 lac Cr. earned in foreign currencies. This industry is facing disruption from green/energy-efficient technology, with Electric Vehicles leading the charge. The electric vehicles industry is estimated to grow to Rs.50,000 crores opportunity by 2025. Significant interest is noticed in this relatively nascent market, even as electric vehicles contributed to ~1.5% of the total vehicle sales in 2019. Avendus Capital, in its recent report, expects the contribution from 3W, buses, and 2W to drive adoption soon (Figs. 1 & 2).
Fig 1: Electric vehicles sales (units) – 2019
Fig 2: Key categories for EV sales by 2025
Fig 3: Mobile handset sales Year on Year
The migration to Electric Vehicles is currently slow but expected to disrupt players across the automotive value chain – Manufacturing and Sales & After-sales
Manufacturing includes Original Equipment Manufacturers (OEMs), their suppliers (Tier-1 OES), and their suppliers (Tier-2, Tier-3, and Raw Material manufacturers). Sales & after-sales include many players such as dealerships, energy infrastructure partners, financiers, authorized service stations, unorganized road-side mechanics, spare parts sellers, and branded/unbranded used vehicle network. Customers and regulatory bodies wield considerable influence on each of these players and accelerate or dampen the pace of disruption. In a 2-part series, Qwixpert will elaborate on the key trends, their implications across the value chain, and recommended responses for sustained business performance.
Portfolio diversification, capability development, and product innovation are critical for manufacturers to stay ahead in the EV revolution
Technological readiness and upskilling are imperative for success in the EV era
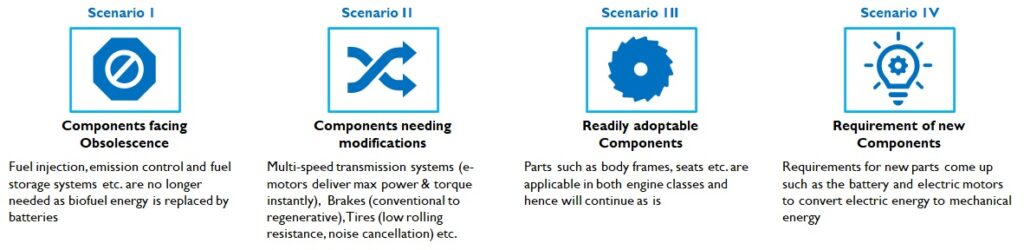
Electric vehicles are much simpler than their Internal Combustion Engine (ICE) counterparts. As per Avendus’ research, a typical EV has 24 moving parts compared to ICE’s 150 moving parts. A comparison between the two technologies highlights four scenarios. (Fig 4)
Fig 4: Four scenarios due to changing automobile technology – ICE to EV
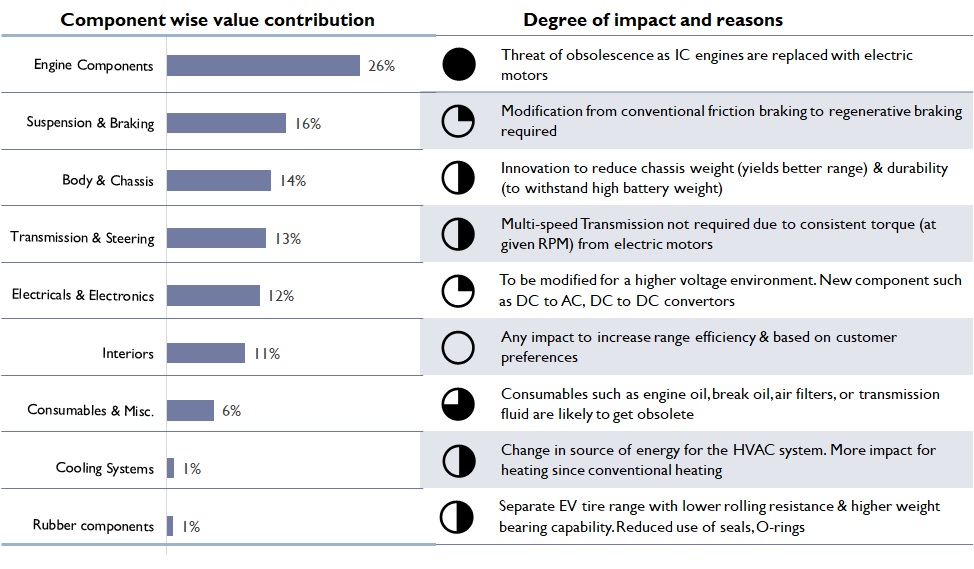
Firstly, several parts are expected to become obsolete. The injection, emission control, and fuel storage systems are no longer needed as batteries replace biofuel energy. Secondly, existing parts may undergo modifications, as multi-speed transmission systems as electric motors deliver power instantaneously. Conventional brakes are to be replaced by regenerative brakes. Tire manufacturers are modifying their designs to develop lower rolling resistance and noise generation. Thirdly, new parts’ requirements come up, such as the battery and electric motors to convert electric energy to mechanical energy. Finally, parts such as body frames, seats, etc., are applicable in both engine classes and will continue.
Fig 5: Impact of EV adoption for each of the auto components
Indian Government has an ambitious vision of ensuring 100% EV by 2030. The implications of these possibilities are currently minuscule due to the low contribution of electric vehicles to the overall automotive sector. The impact of even a 10% migration in vehicle sales to EV will be substantial as the automotive industry employs over 7 million people (2 million by OEMs, 5 million by component manufacturers). There are an additional number of people involved in service stations and dealership networks as well.
The projected impact is twofold. Primarily, product obsoletion will precipitate business closures. MSMEs involved in supplying to Tier-2 and Tier-1 vendors of OEMs will need to shut shop unless a technology migration path to EV is set-up. Secondly, new and modified auto components require new skills. Lower moving parts also indicate automation opportunities, leading to job losses among the semi-skilled or unskilled labour force. There is a compelling need for holistic upskilling to create a sustainable supply of high skilled labour. The Government must ensure new courses and upgrading existing syllabuses of colleges, institutes, and polytechnic centres. In the near-term, manufacturers must spend on upskilling their workforce to remain increasingly relevant.
Auto component manufacturers investing in upskilling and R&D to deliver cutting edge product innovation are expected to succeed in the EV era. Suppliers dependent on principals’ designs to operate a cost-efficient production unit will need to engage principals for business sustenance.
White spaces emerge due to high import dependence; Co-opetition a must among manufacturers
Auto component suppliers must assess their portfolios on the extent of exposure of obsoletion. The suppliers must actively integrate product mix diversification into their business plans to ensure long term business solvency. Companies can also go aggressive in identifying white spaces and quick wins (products with greater synergy with an existing portfolio, good market size, a higher degree of import substitution, and low investment activity at present). The majority of the EV parts (>90%) are imported today due to a lack of manufacturing infrastructure and skill gaps. Products such as the battery, chargers, electronic controllers, power converters, electric motor, and transmission are mostly imported, and these contribute to more than 2/3rd of the cost of an EV. Such import dependency presents a massive import substitution opportunity, especially for early movers. Indigenous OEMs and OES can partner with global EV leaders to fill technological and skill gaps. The Exide-Leclenche JV and Amara Raja-Gridtential Energy partnership are examples in this regard.
Platform approach in passenger vehicle development needs to be extended to electric vehicles to drive down initial costs and encourage faster adoption. Volkswagen has created a 4W EV platform called MEB and has extended it across its subsidiaries such as Audi, Skoda, and Volkswagen. The CMF-EV platform is an extension of Renault, Nissan, and Mitsubishi’s partnership to its Electric Vehicle range. Cooperation among OEMs at a scale never seen before is expected. The platform approach will help faster implementation of technologies such as battery swapping. Anxiety among customers w.r.t adequate post-purchase support catalyzing the pace of adoption. Platform approach and co-opetition to standardize components (especially battery) also support adoption.
New raw materials and battery technology present lucrative investment opportunities
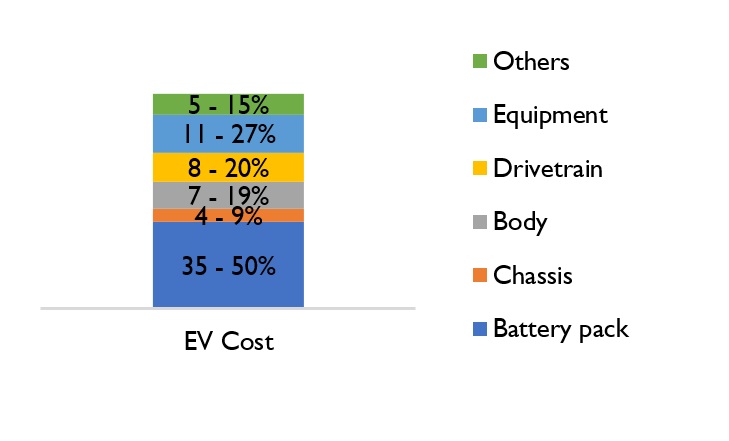
Batteries can make up as much as 50% of the EV cost (Fig 6). Several studies link the lower-paced adoption of electric vehicles to the higher initial cost, and battery technology is intricately connected to the demand. The cost of battery has come down from > $1,100 / kWh in 2008-09 to $156 / kWh in 2018-19. The inflection point for widespread adoption is expected to be $100 / kWh—the experts time this between 2022 and 2025.
Fig 6: Cost of individual components in an EV
China, Korea, and Japan control ~95%+ of global battery production. Countries across the globe are encouraging investments with incentives and subsidies. Manufacturers setting up new facilities in India can expect incentives of up to $25 / kWh. 3 Li-ion battery units with a combined capacity of 10 Gigawatts are expected to be set-up in Telangana with a total investment of Rs. 6,000 Cr. A phased increase in import duties of battery components from 5% to 15% will hasten battery manufacturing indigenization.
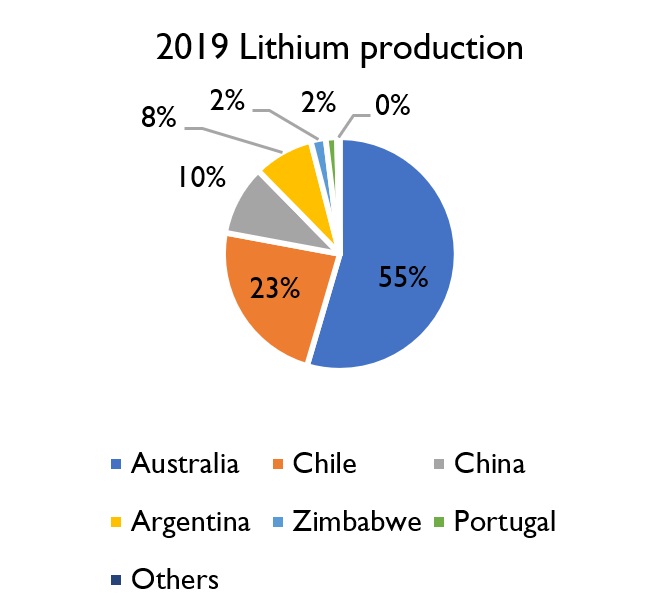
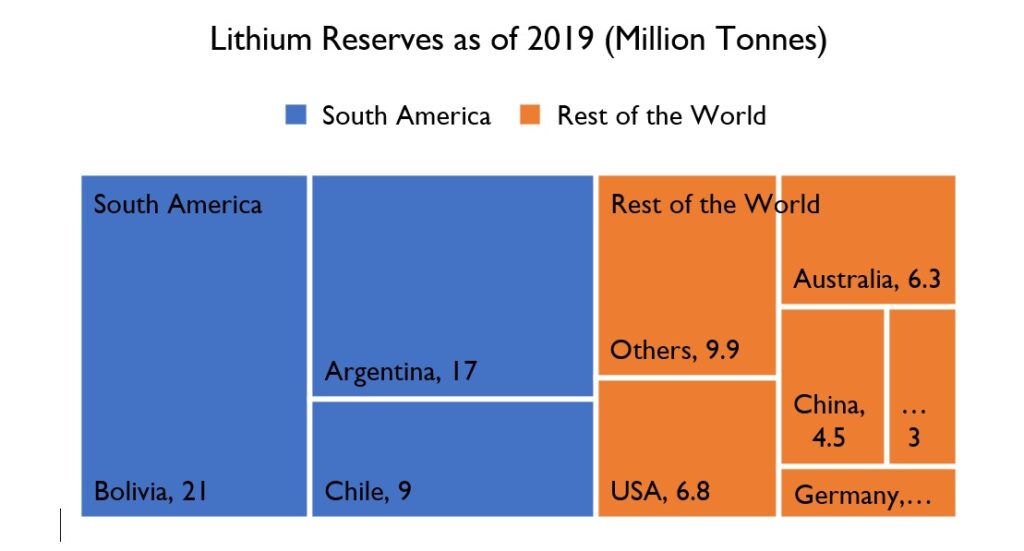
Crude oil prices are seeing a declining trend and are expected to continue in a downward trajectory. Experts across the globe believe the coronavirus pandemic may have accelerated a global energy transition away from oil. Asset write-offs worth $22Bn from Royal Dutch Shell and $17.5 Bn from BP in Jul’20 highlight the hastening pace of decarbonization across the world. Mainstreaming electric vehicles will create massive spikes in demand for raw materials such as Lithium, Cobalt, Manganese, etc., integral to manufacturing rechargeable batteries. The global focus may move away from the gulf to the top Lithium producing countries such as Australia, Chile, and China (Fig. 7). Analysis of the known reserves indicates a prospective geopolitical shift from the Gulf to South America (Fig. 8), if and when Lithium becomes the new oil.
Fig 7: Lithium production across the world
Fig 8: Lithium reserves across the world
Another key trend is suppliers’ investing in value engineering to increase vehicle range by making it lighter using Fibre Reinforced Plastics (FRP) for chassis. Tyres are also undergoing redevelopment to lower rolling resistance without compromising safety and increase fuel efficiency. Disposal, however, is a concern. Less than 5% of all spent Li-Ion batteries are recycled. FRPs cannot be reused, and higher costs of Lithium recycling (vs. mining for new Lithium) has led to inefficient disposal (landfills) with potentially harmful environmental effects.
Further, recycling is essential to harness rarer metals such as cobalt to avoid shortages during widespread adoption. Companies such as Redwood Materials, set-up by Ex-Tesla employees, are hence building recycling and disposal solutions. Current regulations around Li-Ion battery recycling are nascent and do not put the onus on manufacturers, unlike the food packaging industry. If it develops in the future, such a scenario may increase the initial cost to the customer.
Conclusion
Electric vehicles’ impact in the automobile industry is expected to be similar to that of smartphones in the mobile handset industry. Despite Electric Vehicles contributing to only 1.5% of total vehicle sales in 2019, the manufacturing circles are abuzz. With a 50% reduction in moving parts, several Tier-1, 2, and 3 suppliers must assess and diversify their portfolios to future-proof their businesses. More than 90% of the electric vehicle parts are imported, creating massive opportunities in import substitution. However, technology partnerships and rapid upskilling are critical. Early movers are set to gain massively as the Government offers subsidies and increases duties to enable indigenization. Co-opetition through a platform approach for vehicle and component development will benefit the entire manufacturing ecosystem. As battery costs make up 35% – 50% of total vehicle cost, countries with natural Lithium reserves are set to gain. Value engineering to reduce costs and improve vehicle performance are expected to continue as customer anxiety over higher initial investment acts as a key barrier to migration. India must act fast to offer cost-efficient and high-quality manufacturing options to Electric Vehicle players across the world.
Authors: Giridharan Raghunathan, Maheswaran Ganapathy and Rahul Das
Ola’s road to profitability: What lies ahead for one of India’s favorite unicorns?https://qwixpert.com/wp-content/uploads/2023/07/Microsoft-stock-image.jpg1080720qwixpertadminqwixpertadminhttps://secure.gravatar.com/avatar/392f1042eaff5c1f343a179d15026010?s=96&d=mm&r=g
Executive summary
Very few businesses can lay claim to changing the habits of a population. Ola, with its convenient and cost-effective cabs, has changed how India travels. However, the business is yet to sustain itself financially. With the increasing customer acquisition cost for their 4W intra-city taxis and the need to turn profitable, Ola ventured into more cost-effective mobility options (carpooling, autos, 2 wheelers). Recent numbers on # of rides per day show a certain stagnation – 3.5 million/ day in 2018 vs. 3.65 million/ day in 2019. A slew of regulations issued by the Road Transport Ministry aims to limit aggregator commissions to 20%, surge pricing to 1.5X, increase formalization of the workforce (drivers), and ensure driver and rider safety. These measures squeeze Ola’s margins on either side. Hence, the road to profitability has to take two paths – premiumization of existing offerings and efficiency in operations. 4 solution themes, Driver marketplace, Electric Mobility, Strategic Partnerships, and Analytics for premiumization, present themselves. There is significant value in investing in all four, as our analysis show.
Ola’s growth is staggering with several cost elements in check or along the path; Driver expenses as a proportion of revenues are the focus for profitability
The disruption in cab-rentals in India with the arrival of Ola in 2010 and Uber a few years later is well known. Their aggregator business model with an attractive combination of convenience and economic value for riders and the driver-partners has potentially changed riding habits for generations to come. Industry estimates indicate that Ola and Uber offer ~3.65 million rides every day, i.e., more than a billion rides every year.
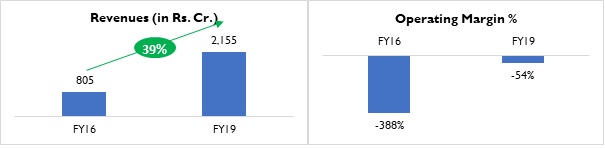
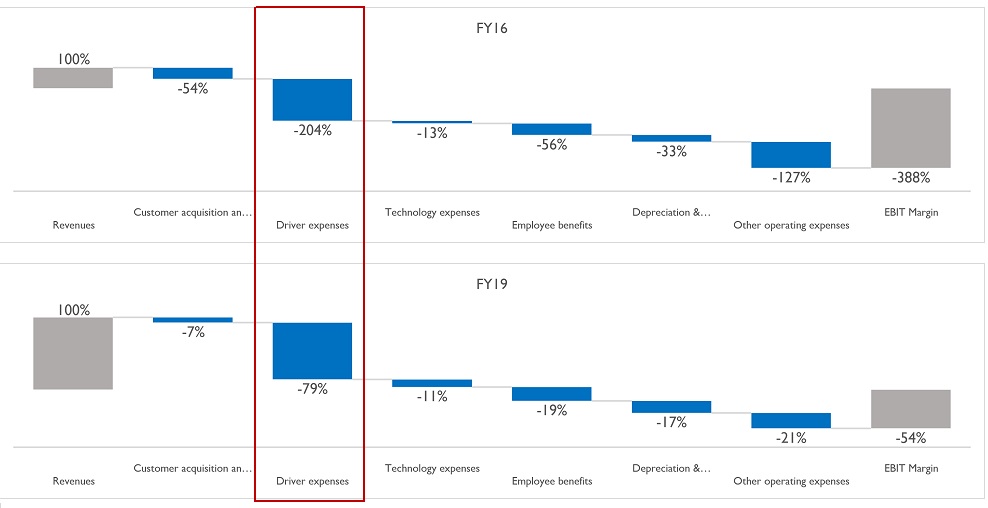
Billions of rides every year offered by 2.5 million driver-partners is no small achievement. But for any business to sustain, it must be profitable. A glance at the FY19 financials for ANI technologies indicates that the Operating Margin is -54% (Fig 1). A comparative analysis of the same metric in the past suggests the Operating Margin has improved from -388% in FY16. The result has come on the back of a tremendous CAGR of ~39% in revenues (Fig 1).
Fig 1: Revenue and Operating margin – FY19 vs. FY16
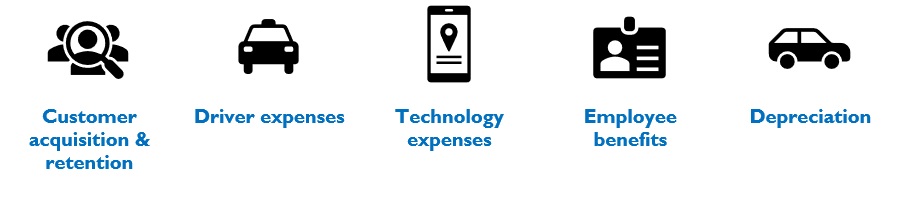
Ride-hailing services have 5 primary operating costs (Fig 2)
Fig 2: ANI Technologies – Key Cost elements
Qwixpert team analysed the trajectory of each of these cost components for Ola (Fig 3). Sharp decreases in all cost elements indicate significant cost-cutting and efficiency improvement measures. “Driver expenses” remain critical to profitability.
Fig 3: ANI Technologies Operating margin waterfall (all values in % of revenues) – FY19 vs. FY16
Ola, in early 2020 decided to cap driver incentives to 5% of earnings, stating that the previous system, based on trips and logins, was seen as arbitrary and not to the liking of drivers. Commissions charged by Ola (i.e., Ola’s revenues) were simultaneously capped at a fixed 20% to ensure clarity among the driver community on their estimated daily and monthly earnings. These moves have led to driver’s earning falling, leading to lower cars on the road. This move could potentially manifest into a downward spiral with lower vehicles on the road, increasing waiting times for customers and hence higher churn, further impacting driver earnings.
Regulatory oversight into ride-hailing has increased. Parliamentary panels and Road Transport ministries have acted on appeals and complaints from the driver and rider community. New guidelines issued impact current margin improvement methods. Capping surge pricing, aggregator commissions (as a % of trip revenues), and the number of driving hours per day restricts earnings potential. Compliance with guidelines of daily driver log-in hours and social security benefits to drivers will increase costs.
The most critical dilemma that ride-hailing companies are trying to solve – Increase revenues and minimize driver expenses proportionate to incomes – has become more difficult.
Qwixpert explores four potential solution themes to achieve these twin objectives
It is time for a marketplace model for drivers, and ride-hailing companies have every incentive to enable this
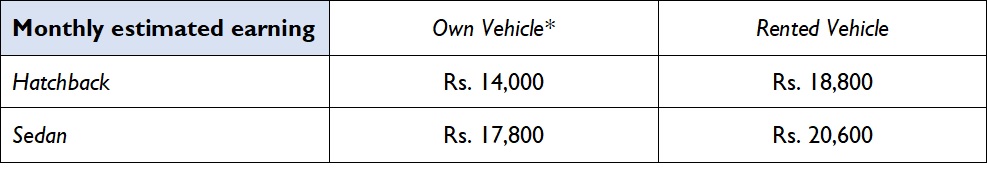
It is extremely crucial to understand the earnings profile of a ride-hailing driver. Considering a city taxi in an urbanized set-up like Delhi-NCR, where the driver works for 25 days in a month and is driving ten effective hours/ day, we have estimated earnings across 4 scenarios. In each of these scenarios, no additional incentives have been considered. A 3-year loan repayment period is considered, while the resale value is not included in the business case calculations.
Fig 4: Monthly earnings estimate for drivers-partners (w/o incentives)
Driver availability throughout the day and across locations is a key challenge. Hence, to incentivize drivers to stay logged in for longer and take those extra rides, bonuses based on total rides/day were introduced. The incentive system is neither sustainable financially for Ola nor safe for its riders (drivers staying on the road for long hours).
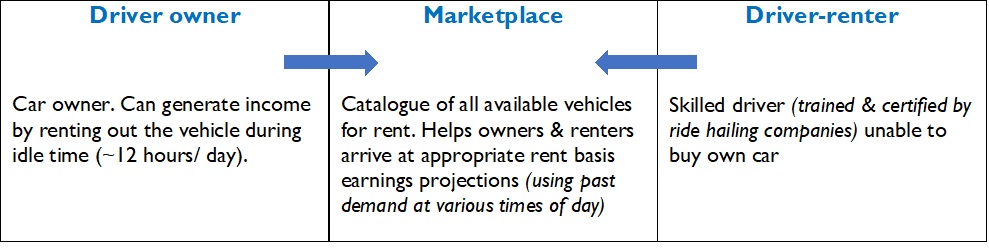
Getting new drivers on board to match the aggressive growth targets is also a challenge. High sign-up bonuses encourage drivers to take vehicle loans. Many drivers are unable to pay their EMIs as their loans are from local financers, charging high-interest rates. A marketplace model (Fig 5) will be useful in such a scenario.
Fig 5: The marketplace model
Since Ola allows multiple driver tagging to the same Vehicle (but only one at a time), smart fleet owners already use this model to maximize asset (taxis) utilization. Concerns regarding vehicle safety can be ensured by taking a security deposit from the 2nd driver and training and certifying driver-renters using Ola Skilling. Rent and/or revenue sharing models can be estimated using analytics.
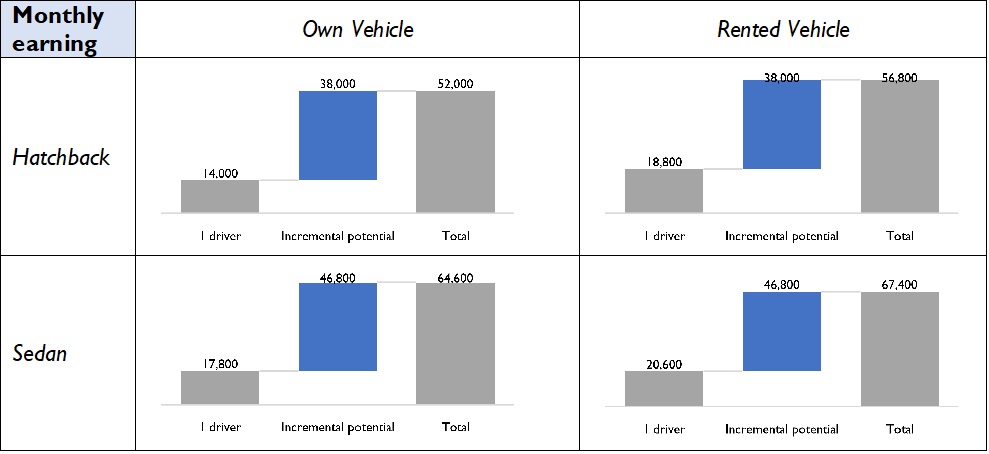
Fig 6: Monthly earnings estimates for driver-partners (w/o incentives) – 2 drivers/ car
Qwixpert estimates a 200-270% increase in monthly earnings from a car through the marketplace model (Fig 6), as fixed costs of owning a car (Eg: EMI, taxes, Insurance) get apportioned over a larger revenue base.The marketplace model is a win-win for all: consumers (higher levels of service), drivers (higher incomes), and the aggregators (increased market access and reduced incentive payments).
Betting on Electric Vehicles and investing in them for long term
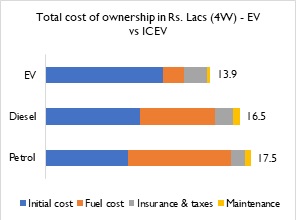
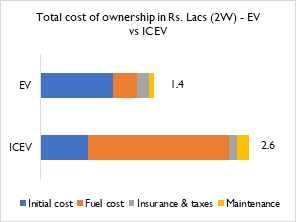
Total Cost of Ownership (TCO) analysis of EVs vs. ICEVs (Figs 8 & 9) for 4 wheelers and 2 wheelers indicates higher life-time value for the taxi segment, especially Taxis driven for longer distances every day. With the impetus from the Government to push EV adoption through subsidies, grants, and infrastructure-focused stimuli, EVs can generate significant earnings for the aggregators and the driver-partners.
Fig 7: TCO for 4W Sedan running ~150km/ day for 3 years
Fig 8: TCO for 2W running ~100km/ day for 3 years
Ola’s strategic investment in Ola Electric Mobility is a step in this direction. A spate of investments from existing investors (Softbank and Tiger Global) and Global Auto OEMs (Hyundai and Kia) has made Ola Electric Mobility a Unicorn in its own right. Outside of investing in an all-electric vehicle fleet of cars, 2-wheelers, and autos, Ola electric is investing in support infrastructure, i.e., battery-swapping and charging stations. EV fleet can also be integrated into the marketplace model with a substantial increase in returns.
Strategic partnerships with select operators across the hospitality space can help tap into premium customers withncreased effectiveness
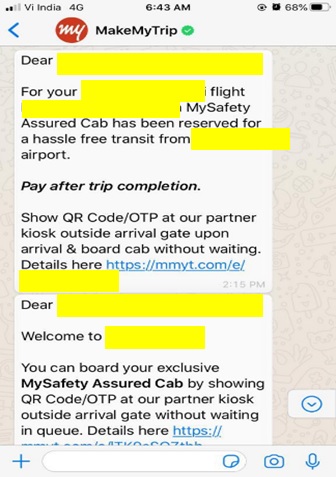
There are lots of synergies to be generated from strategic partnerships with hospitality services. Meru has tied up with MakeMyTrip (Fig 9) and is jointly promoting their cabs at airports through messages and email to customers who have booked tickets on MakeMyTrip. Their prompts across communication channels help reduce the traveler’s wait time once he/she lands. This example can be extended to other aggregators such as Zomato, where a customer booking a table at their favorite restaurant can be prompted to book a cab then and there. Analytics can be leveraged to prompt the rider after a reasonable amount of time, basis the type of destination, to book the return-cab. Partnership opportunities exist with BookMyShow, Booking.com, and other services of similar nature. Swiggy has also leveraged this synergy as customers booking an order are now given the option to watch a Netflix movie trailer.
Fig 9: Meru–MakeMyTrip partnership
Analytics at the front and center of revenue enhancement strategy
The alternative approach to proportionately reducing driver expenses is increasing revenues. The concept of surge pricing combines analytics with demand-supply economics. Incentivizing drivers who brave harsh weather and traffic conditions with higher fares and commanding a premium from customers for operating taxi services in such conditions are the key notions behind surge pricing. Likewise, ride-hailing services have also leveraged advanced analytics to ensure maximum driver availability at high demand routes, maximizing a driver’s earning potential and minimizing waiting times for riders. Qwixpert estimates several other applications, as below
Customer segmentation (categorizing customers into distinct segments) basis their ride-hailing behavior – Value conscious, service-oriented, etc. can yield a plethora of business benefits
Premiumization:Customers willing to pay a premium for higher service value can be actively encouraged to upgrade to higher-value offerings (Eg: Mini -> Prime)
Marketing effectiveness: Incremental RoI from marketing initiatives (Eg: Coupons) to acquire new riders or encourage existing customers to ride more
New product offerings: Frequent cancelations, surge pricing, and longer wait times lead to inferior customer experience for the office goer booking cabs every day. Meru reserve allows them to book cabs to and from the office for 30 days. Analytics helps identify and target the right customers to onboard, thereby enabling the service to scale fast. Over time, Meru can introduce carpooling services basis the office-goer demand footprint to maximize earning/ taxi and minimize carbon footprint.
Demand forecasting analytics: Time-series analysis of booking data can help forecast potential demand from different locations at various points in time. These forecasts can help
Re-route drivers basis demand to maximize driver earning and customer service
Target setting for driver onboarding teams using projections of current & future driver requirements
Build fungible driver business cases to assist driver onboarding teams
Geographic clustering analytics categorizing various cities into clusters based on demographic and macro-economic profiles can help during expansion/ new city launches. Combining geographic clustering with demand forecasting and customer segmentation analytics can accelerate new city launches and support operational decision making (driver onboarding, marketing effectiveness, driver re-routing) in the initial phase.
Conclusion
Outlook for mobility is muted now, especially with work from home continuing to be the norm in the service sector. However, with the active COVID-19 cases falling and several vaccines showcasing promise in 3rd stage trials, vehicular movement is expected to return to pre-COVID levels soon. Ola’s dream of turning profitable may not have materialized yet, and the COVID-19 pandemic has set them back by another year, if not more. But analysis of their financials indicates that they are on the right path. Besides, recent guidelines that limit earnings and increase costs will further impact profitability. Therefore, it is critical to look at long-term initiatives that focus on leveraging operational efficiencies and premiumization of services through incremental customer value. The four solution themes discussed – driver marketplace, electric mobility, robust data analytics, and strategic partnerships – can drive these objectives and achieve sustainable profitability.